Garmin Forerunner 301 and MotionBased.com
Just when I thought it couldn’t get any cooler with the GPS based 301 unit I discover MotionBased.com, a web site that really puts the functionality into the Forerunner 301. From the web site, “MotionBased is a web application that translates GPS data into functional analysis and online mapping for endurance and outdoor athletes… MotionBased automatically calculates time, distance, speed, elevation, and heart rate metrics and displays this information through meaningful charts, illustrations, reports, and maps. Take the second-guessing out of your training routine and make it more fun at the same time.”
Sound dry? Not a chance. You’ve got to see what the Garmin and this web site can do together. Below are screen shots taken from one of my recent training rides. This ride takes me over Godde Hill, a local 8-9% bump in the relatively flat Antelope Valley.

Map Player Page
Check out dot racing on the map player page; "The "player" aspect of this section allows you to simulate the activity along the map and the elevation profile with a moving "dot" indicator. The "dot" is controlled with standard media controls (Play, Pause, Forward, Reverse, and Speed). You may also interact with the map and elevation profile by zooming in, zooming out, panning, and displaying roll-overs on key sections of the illustration."
Or how about...

"The Dashboard"
The MotionBased Dashboard allows you to analyze core training metrics for a specific activity. The Dashboard is broken out into 8 sections: summary, elevation, time, workout, distance, lap, speed, and weather.
And I especially love...

Heart Rate Analysis
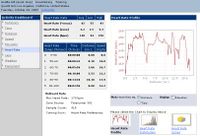
Man, if you love data, and who doesn't, you’ve got to love the Garmin and this web site. I’ve just given you the tip of the ice berg here – go see it for yourself.
Click this link My Godde Hill Ride it should allow you to explore all the data associated with my 1 hour training ride - you know you're going to want to upload all your rides!
Sound dry? Not a chance. You’ve got to see what the Garmin and this web site can do together. Below are screen shots taken from one of my recent training rides. This ride takes me over Godde Hill, a local 8-9% bump in the relatively flat Antelope Valley.

Map Player Page

Check out dot racing on the map player page; "The "player" aspect of this section allows you to simulate the activity along the map and the elevation profile with a moving "dot" indicator. The "dot" is controlled with standard media controls (Play, Pause, Forward, Reverse, and Speed). You may also interact with the map and elevation profile by zooming in, zooming out, panning, and displaying roll-overs on key sections of the illustration."
Or how about...

"The Dashboard"

The MotionBased Dashboard allows you to analyze core training metrics for a specific activity. The Dashboard is broken out into 8 sections: summary, elevation, time, workout, distance, lap, speed, and weather.
And I especially love...

Heart Rate Analysis

Man, if you love data, and who doesn't, you’ve got to love the Garmin and this web site. I’ve just given you the tip of the ice berg here – go see it for yourself.
Click this link My Godde Hill Ride it should allow you to explore all the data associated with my 1 hour training ride - you know you're going to want to upload all your rides!


<< Home